Research question
What can digital geometry establish about a thin enclosure, and which uncertainties still need a physical prototype?
Method
Across three design revisions, the study separates printable fit models, component layout and a rear-seal model. It audits exported meshes, re-imports assembly STEP files, calculates tolerance sensitivity and checks the connector against the frame.
Key findings
- Early print files checked
- 12
- Later print layouts checked
- 2
- Valid assembly STEP re-imports
- 2
- Twelve early print files and two later print layouts had closed, consistently wound meshes. Both assembly STEP exports re-imported as valid geometry.
- The gap sensitivity calculation widened the estimated gasket squeeze range. The connector study also found that zero overlap could coincide with contact.
Limitations
The results describe CAD geometry and calculated sensitivity. Ingress resistance, strength and electrical performance still need physical testing.
Full manuscript
Web reading edition of the submitted manuscript, including text, original figures, tables and references.
Abstract
A thin enclosure can survive a digital interference check while retaining unresolved risks at its gasket, ports and moving interfaces. This study presents a staged CAD verification method and applies it to three versions of a 62 × 90 mm handheld electronics enclosure. The stages use printable surrogates to isolate fit questions, supplier-dimensional envelopes to resolve component packaging, and a separate model to examine a mixed-material rear seal. The evaluation combines an archive audit, independent geometry re-import, a deterministic tolerance calculation and a follow-up connector alignment study. Twelve early print files and two later print layouts retained closed, consistently wound meshes. The two assembly STEP exports re-imported as valid geometry. Changing the sealing gap by ±0.03 mm beyond the dimensions in the release calculation expanded the modelled squeeze interval from 16.30–26.21% to 11.85–30.34%. A 1.49 mm connector translation removed a nominal frame intersection of 1.078 mm³. At a further translation, the zero-overlap configuration touched the frame. These outcomes inform the next prototype and its tests. The study supplies no physical ingress, strength, electrical or radio-frequency qualification. An evidence matrix records the assumptions, observations and remaining measurements for each interface.
Keywords Engineering design; virtual prototyping; electronic enclosure; CAD verification; tolerance analysis
Article Highlights
Fit models, component layouts and seal models answer different engineering questions.
Geometry checks were repeated on the exported manufacturing and assembly files.
A 0.03 mm change in sealing gap noticeably widened the calculated squeeze range.
The verification matrix links each design decision to the next physical test.
1 Introduction
A handheld electronics enclosure has to satisfy several mechanical constraints within the same thickness. The front stack contains a display and cover. The rear stack can carry a cell, fasteners and magnets. Ports and side keys interrupt walls that might otherwise provide continuous sealing surfaces. When an industrial design moves from a visual model to supplier-sized electronics, small changes in part thickness can consume clearance that was previously available for mounting or sealing. A model that passes a static geometric check cannot resolve material deformation, connector fit after manufacture or leakage at an adhesive interface.
The question in this case is how an enclosure team can carry evidence forward as the prototype moves from form and fit to component packing and sealing. Three revisions of the same project provide the design history. The study traces what changed, repeats checks on exported geometry and uses a sensitivity calculation to expose the consequences of an unresolved sealing gap. The resulting method ties each design release to the decision it supports, the model exclusions that limit the decision and a physical measurement that would permit the next release.
Houde and Hill [1] describe prototyping in terms of the questions a prototype is built to answer. Camburn et al. [2] give a systematic method for selecting prototyping strategies, including whether to isolate a subsystem. In a hardware enclosure, isolation can take the form of a printed fit coupon, a model of a folded interconnect or a sealing coupon. Adam and Zimmer [3] examine geometry-specific design rules for additive manufacturing. The implication here is that a coupon can address how one interface prints on a selected process, while its result depends on material, orientation and machine setup. A digitally closed print file is a precondition for a useful coupon, with fabrication and fit remaining separate observations.
2 Method and case material
2.1 Revision and evidence records
The case uses archived STEP assembly exports, stereolithography (STL) print meshes, release-verification records, a bill of materials and the open-issue register. The source files were read without modifying the project. The first revision, P1, isolates form and fit. P2 is a supplier-dimensional component placement study. P3 changes the enclosure structure and sealing interfaces while retaining the nominal 62 × 90 mm body footprint. A subsequent interface review compares the P3 enclosure with two port placements on a common datum. A revision label does not identify a production release. Test outcomes use three evidence categories: repeated file checks, prior documented CAD checks and analytical calculations. Future physical tests are identified separately.
An interface record uses five fields. It names the design requirement, identifies the representation where the requirement is addressed, gives the measurable criterion and result, records assumptions and exclusions, and states the next check before a claim can be carried forward. For example, the requirement that a port remain accessible is first represented by a printable opening and fit coupon, then by a connector plus the panel geometry. A clear nominal fit in the latter model remains conditional on measured connector dimensions and actual panel tolerance. Retaining the earlier record prevents the purpose of a fit check from being confused with evidence of enclosure sealing.
2.2 Independent file checks
The audit used CadQuery 2.8.0 to load the released P2 and P3 STEP assemblies and obtain the validity flag, solid count and Cartesian extents. Trimesh 5.2.0 was used to load 12 individually exported P1 STL files and the two later print layouts. The checks record boundary closure, consistent triangle winding, connected shell count and bounding-box dimensions. Lengths are interpreted in millimetres under the project’s export convention. An STL has no inherent unit designation. The file checks do not examine printer shrinkage, build supports, wall strength or assembled clearances.
Historical rigid-body checks were separately read from each release. The P3 procedure screened pairs using axis-aligned overlap greater than or equal to 0.002 mm on each axis, then measured intersection volume. A volume greater than 0.003 mm³ was reported as a collision. Fasteners, contacts within battery subparts and selected same-family geometry were excluded. Exceptions and thresholds are part of the method because a report of zero collisions otherwise hides what was tested. The repeated re-import establishes digital file consistency. It does not independently recompute every archived rigid-body pair.
2.3 Gasket and mass calculations
For a gasket with free thickness t and width w in an ideal rectangular gland with depth d and width b, define the engineering squeeze as S = 100(1 − d/t) and the nominal section fill as F = 100wt/(bd). Independent bounded dimensional variation is assessed at the extreme corners of the given input intervals, following the distinction between worst-case and distribution-based tolerance analyses [4]. Because the expressions are monotonic for positive dimensions, the chosen corners give exact bounds for these expressions. They give no probability of occurrence. Static face-seal guidance identifies additional dependencies including material, finish and distortion [5]. The design uses a simplified strip section. The handbook therefore informs the interpretation and does not supply a pass criterion for this custom gasket.
A separate perturbation adds or subtracts 0.03 mm to the effective gland gap while preserving the other input bounds. This is a controlled sensitivity condition, not a measured deflection or a requirement. One gap increment may describe an opening caused by local deformation, and the opposite sign describes closure. The calculation does not assign a uniform gap change to a physical backplate or predict contact pressure along the perimeter. Rear plate mass was calculated from the STEP solid volume using 1.85 g/cm³ for the composite and 8.00 g/cm³ for a same-geometry steel comparison. Material density is an assumption and the comparison holds geometry fixed.
3 Results
3.1 Print fit and component packing
P1 used separate rear and front shells, keys, four dimensional surrogates and four coupons. The coupons represented the connector opening, pilot and fit features, a plug gauge and a magnet seat. The nominal envelope was 62 × 90 × 6.0 mm with a documented default fit gap of 0.25 mm per side. Twelve of twelve P1 meshes were closed and consistently wound. Their bounds corresponded to their intended print layouts, not to a completed assembly. For example, the rear shell and front cover stand 5.0 and 3.5 mm high in their independent print orientations. Adding these heights would misstate assembled thickness because the components have overlapping assembly features.
P2 adopted a 62 × 90 × 6.8 mm case. The change is 0.8 mm or 13.3% relative to the P1 nominal thickness. This was a layout revision involving several constraints, so the change cannot be attributed quantitatively to one component. The earlier printable cell surrogate was 1.7 mm thick. P2 used a candidate cell envelope with a 3.5 mm maximum thickness and 0.5 mm nominal clearance to the display. The printed surrogate had been suitable for checking the concept model. The discrepancy identifies why supplier evidence must replace it before component packaging decisions are made.
The 54 × 82 × 0.6 mm nominal board shape used a 13.5 × 34 mm opening for the cell. The display interconnect included a 14.3 mm route, a 6 mm straight terminal reinforcement and a 0.5 mm modelled bend radius. The selected display connector and USB interface had small nominal margins, including a 0.15 mm connector-to-display clearance. The design archive identifies the flex dimensions, bend and connector engagement as items requiring sample review. The available board file is a mechanical placement representation. It does not establish that the board can be routed or assembled with qualified electronics.
Table 1. Independently re-imported digital deliverables.
| Stage | Exported geometry | Observed closure or validity | Count | Extent (mm) |
|---|---|---|---|---|
| P1 | 12 individual print STL files | All closed and consistently wound | 12 separate exports | Part-specific |
| P2 | Assembly STEP | Valid geometry | 506 solids | 62.4 × 90.0 × 6.8 |
| P2 | Print layout STL | Closed, consistent winding | 4 shells | 153.60 × 90.0 × 5.8 |
| P3 | Assembly STEP | Valid geometry | 533 solids | 62.5 × 90.0 × 6.8 |
| P3 | Print layout STL | Closed, consistent winding | 14 shells | 143.10 × 177.53 × 6.0 |
The independently imported P2 and P3 assemblies were geometrically valid, with extents of 62.4 × 90.0 × 6.8 and 62.5 × 90.0 × 6.8 mm, respectively. The two widths include the side-key projection. Their print meshes contained four and fourteen connected shells. P3 lists ten named printable entries and fourteen shells because a named model can contain multiple disconnected pieces. The quantities measure different features of the representation. Similarly, the imported STEP solid counts of 506 and 533 include detail geometry and should not be interpreted as the number of production parts. The archive reports 339 and 413 narrow-phase pairs for P2 and P3, with no reported unexpected nominal intersections under their respective exclusion rules.
3.2 Material and sealing interfaces
P3 moved the principal opening to the rear of a steel front-and-side frame and placed a continuous face gasket around the rear plate. Screws, the display perimeter, the radio-frequency window, the key openings, the USB interface and the vent were represented as distinct interfaces. The continuous perimeter is therefore one of several possible paths. The USB component candidate is specified by its manufacturer for a water-resistance test [6]. Its assembly still depends on the panel seat and installation. IEC 60529 provides the relevant enclosure-level classification framework [7], and the design target in the case record has not been verified.
The re-imported rear plate volume was 4,497.79 mm³. With the selected densities this corresponds to 8.32 g for the composite and 35.98 g for the equal-volume steel reference. The calculated difference is 27.66 g. The archive also reports 45.4 g for the separate steel part subtotal. These are not total assembled-device mass values. Equal-volume substitution isolates the mass effect of density, without establishing equivalent stiffness or a design that could be manufactured in either material unchanged. The rear plate has a 0.8 mm nominal region and local 2.4 mm bosses. Fastener loads and out-of-plane deflection at the seal remain open questions.
3.3 Seal gap sensitivity
The nominal gasket section is 0.60 × 0.70 mm in a 1.05 × 0.55 mm gland. Nominal squeeze is 21.43% and nominal fill is 72.73%. Free thickness bounds are 0.675 and 0.725 mm, and gland depth bounds are 0.535 and 0.565 mm. These yield squeeze bounds of 16.30 and 26.21%. Using the maximum free width of 0.63 mm and minimum gland width of 1.02 mm gives the release high-corner fill of 83.70%.
With an additional ±0.03 mm effective gap excursion, the largest gap becomes 0.595 mm and the smallest 0.505 mm. Squeeze then spans 11.85–30.34%. The high-corner section fill becomes 88.67% when the minimum gap is treated as the available height in the area model. At nominal thickness, a 0.01 mm change in effective gap shifts squeeze by approximately 1.43 percentage points. These results expose the sensitivity to a gap variable omitted by the nominal collision check. They do not demonstrate that such a gap excursion occurs or classify any interval as acceptable.
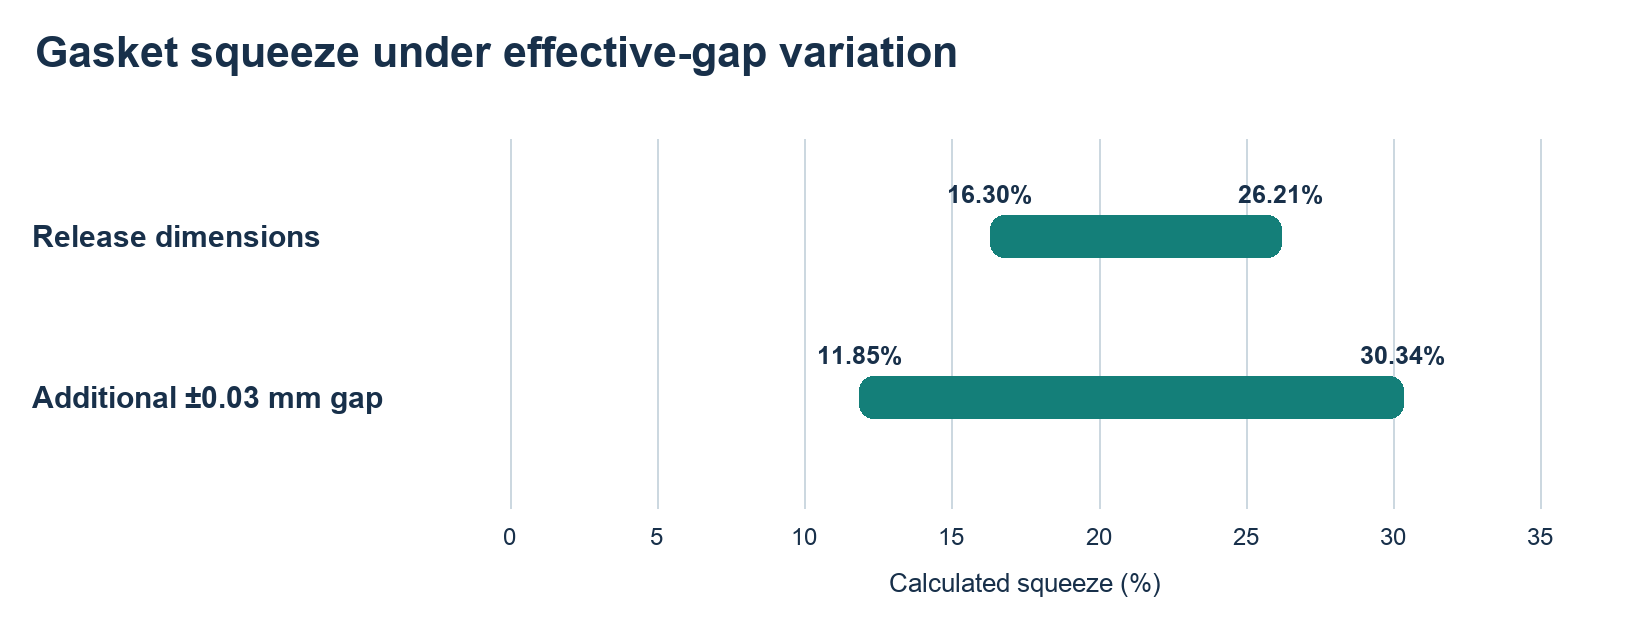
Fig. 1 Calculated squeeze intervals for the release dimensions and an imposed additional gap excursion. OpenAI Codex assisted in plotting the stated model inputs.
3.4 Shared-datum interface verification
The P4 review placed the enclosure solids and PCB interface in a common mechanical frame with X measured rightward from the left side, Y downward from the top, and Z towards the display. The P3 front-frame and rear-plate STEP exports used the opposite Y convention. Each was reflected in the XZ plane at Y = 45 mm, giving y' = 90 mm − y. The review used the same mechanically reconstructed USB-C shell at both poses. In the A0 pose, the shell mouth, board edge and contact row lay at Y = 87.28, 86.00 and 80.42 mm, respectively. In the P4 candidate all three moved 1.49 mm along Y. A rectangular envelope represented the resulting local board extension, independent of the shell.
The nominal check intersected each of the three objects with each enclosure solid in CadQuery 2.8.0. It classified common solid volume above 0.00001 mm³ as overlap. A read-only repeat reproduced all six archived outcomes. The A0 shell intersected the front frame by 1.078133 mm³. The remaining five checks found zero common volume. In particular, the P4 shell and board extension envelope each had zero common volume with either enclosure solid. The board envelope omits the detailed cutout, shell stakes and land pattern and cannot define a board outline for fabrication.
A separate 13-position sweep translated the P4 shell only along Y while holding both enclosure solids fixed. The front-frame intersection decreased to zero by the sampled Y = 88.57 mm and returned at Y = 88.97 mm. The model had a minimum front-frame distance of 0.045 mm at the nominal candidate and zero distance with no common volume at Y = 88.87 mm. The rear-plate intersection was zero throughout. Thus the volume-only test would assign the same outcome to the separated nominal candidate and the sampled boundary contact.
To examine coupled translation, three independent 27-position grids used offsets {−d, 0, +d} along each axis about the candidate. At d = 0.025 mm all samples were separated. At d = 0.050 mm, 18 of 27 overlapped the front frame. At d = 0.100 mm, 24 overlapped and one touched. Touch was classified at a computed distance below 0.000001 mm where overlap was absent. These grid offsets are sensitivity inputs. They do not establish manufacturing tolerances, failure probabilities, plug insertion, seal deformation or product release.
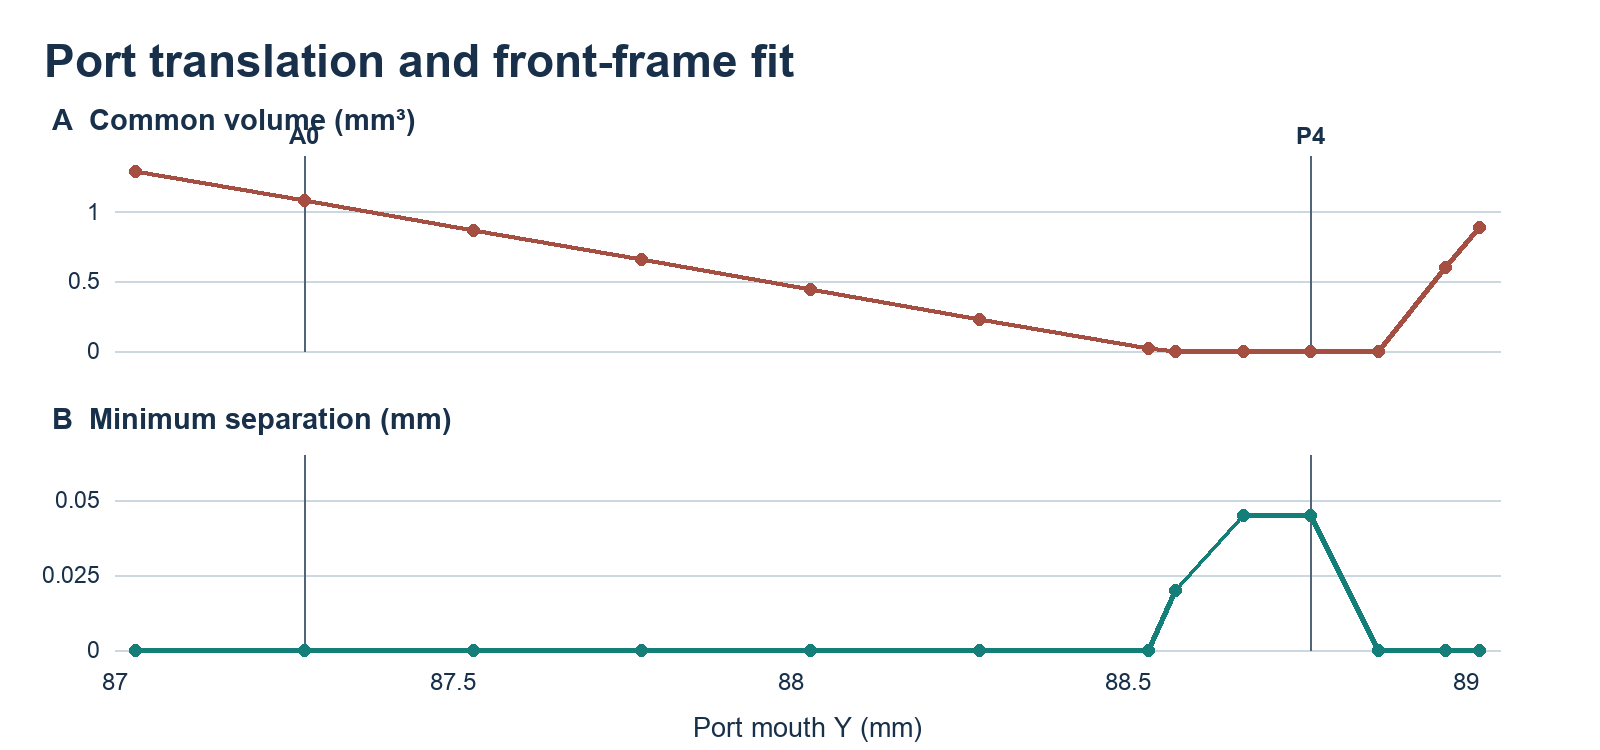
Fig. 2 Common volume and minimum separation at 13 sampled port positions. Lines join samples. OpenAI Codex assisted with plotting computed outputs.
Table 2. Rigid translation grids around the nominal P4 connector pose.
| Offset (mm) | Positions | Separated | Touch | Overlap | Max overlap (mm³) |
|---|---|---|---|---|---|
| 0.025 | 27 | 27 | 0 | 0 | 0 |
| 0.050 | 27 | 9 | 0 | 18 | 0.019579 |
| 0.100 | 27 | 2 | 1 | 24 | 0.245453 |
4 Discussion
The case illustrates a practical consequence of assigning several purposes to one digital model. P1’s local fit parts can support manufacture of a trial piece. P2’s assembled model can support dimensional reconciliation against a candidate electronics layout. P3 can support assessment of gland dimensions and identification of distinct interfaces. The addition of supplier envelopes and a seal solid increases what the CAD model represents. It cannot close a requirement whose acceptance criterion depends on material properties, contact pressure or water exposure.
The results suggest a sequence for using evidence in other compact enclosures. Release fit coupons when the comparison and datum are explicit. Replace surrogates with versioned supplier envelopes and identify which dimensions are maximum, nominal or derived. Export and re-import both assembly and print geometry. Record exceptions before interpreting a zero-interference result. Recompute the tolerance chain separately for each interface whose function depends on pressure, alignment or deformation. In the present case the change to a composite rear plate connects weight, stiffness and compression. A designer can trade those properties only after obtaining deflection and seal evidence under representative assembly conditions.
Table 3. Interface evidence and the physical checks that remain open.
| Interface | Present evidence | Next observation |
|---|---|---|
| Printed shell fit | Closed printable models and nominal gaps | Measure printed coupons and compare fit across material and orientation. |
| Cell and display | Supplier dimensional envelope and nominal clearance | Measure delivered components, foam and loaded spacing. |
| Rear seal and plate | Re-imported plate volume, calculated compression and fill | Measure assembled gap and gasket geometry at multiple points. |
| Port and frame | Shared-datum nominal Boolean comparison | Use actual connector and check insertion, tolerances and local sealing. |
| Enclosure protection | Ingress paths identified in the model | Test a documented physical assembly under the applicable IEC protocol. |
For a follow-on test, the rear closure can be evaluated independently of the electronics. The first measurements would compare the actual gland and free gasket sections with the input intervals. A controlled fastening sequence would then relate the local closure gap at multiple positions to the torque and part variation. Representative coupons can isolate connector seating, membrane and adhesive interfaces before they are combined in an inert enclosure. A later assembled ingress test should use a defined enclosure configuration and applicable standard procedure. It should record the interfaces fitted, the condition of any port closure and the pre- and post-test inspection. This proposed sequence is distinct from the completed file and arithmetic checks.
The case uses a single design history. File validity is tool- and representation-specific, and agreement between the audit and archived release metrics uses the same underlying geometry. The mass comparison uses an idealised reference, while the squeeze bounds ignore surface texture, compression set, elastic response, bending and dimensional correlation. No statistical probability or fabricated physical measurement is inferred. Further validation requires a specimen set, dimensional inspection, controlled assembly and representative exposure. A second enclosure would be needed to assess transfer beyond this case.
5 Conclusion
The study shows how to carry a design requirement from a print coupon to a component layout and onward to an explicit sealing analysis without losing the conditions under which each result applies. Exported geometry passed the repeated checks. The shared-datum connector replay distinguished no volumetric overlap from positive clearance. The deterministic gap sensitivity identified a reason to measure the rear closure before interpreting its nominal gasket squeeze. The evidence matrix records the status of each engineering decision and the measurement required to support a stronger claim.
Data availability
The reported dimensions, audit aggregates and the formulas used to reproduce the published values are included in the manuscript. The original design exports are retained in the project archive. No participant data or laboratory ingress results are used.
Declaration of generative AI use
OpenAI Codex assisted with literature discovery, organization and English drafting from archived project material. It also assisted with the read-only geometry audit script, numerical cross-checks and diagrams. The project records supply the design inputs. The diagrams are derived from the stated dimensions or from the documented revision sequence.
References
1. Houde, S., Hill, C.: What do prototypes prototype? In: Helander, M.G., Landauer, T.K., Prabhu, P.V. (eds.) Handbook of Human-Computer Interaction, 2nd edn., pp. 367–381. North-Holland (1997). https://doi.org/10.1016/B978-044481862-1/50082-0
2. Camburn, B., Dunlap, B., Gurjar, T., Hamon, C., Green, M., Jensen, D., Crawford, R., Otto, K., Wood, K.: A systematic method for design prototyping. J. Mech. Des. 137, 081102 (2015). https://doi.org/10.1115/1.4030331
3. Adam, G.A.O., Zimmer, D.: Design for additive manufacturing—Element transitions and aggregated structures. CIRP J. Manuf. Sci. Technol. 7, 20–28 (2014). https://doi.org/10.1016/j.cirpj.2013.10.001
4. Chase, K.W., Parkinson, A.R.: A survey of research in the application of tolerance analysis to the design of mechanical assemblies. Res. Eng. Des. 3, 23–37 (1991). https://doi.org/10.1007/BF01580066
5. Parker Hannifin: Parker O-Ring Handbook. ORD 5700, O-Ring and Engineered Seals Division. https://www.parker.com/content/dam/Parker-com/Literature/O-Ring-Division-Literature/ORD-5700.pdf
6. Global Connector Technology: USB4720 USB Type-C receptacle and manufacturer test documentation. https://gct.co/connector/usb4720
7. International Electrotechnical Commission: IEC 60529:1989+AMD1:1999+AMD2:2013, Degrees of protection provided by enclosures (IP Code), consolidated edn. 2.2. IEC, Geneva (2013). https://webstore.iec.ch/en/publication/2452